- Published on
🏗️ Building a Centralized Monitoring Architecture with VPC Peering Hub-and-Spoke Pattern
- Authors

- Name
- Geonhyuk Im
- @GeonHyuk
Building a Centralized Monitoring Architecture with VPC Peering Hub-and-Spoke Pattern
When managing multiple environments (development, staging, production) in AWS, one of the key challenges is implementing centralized monitoring while maintaining proper network isolation. In this post, I'll share how I designed a hub-and-spoke VPC peering architecture that provides centralized monitoring capabilities while ensuring each environment remains isolated from others.
Architecture Overview
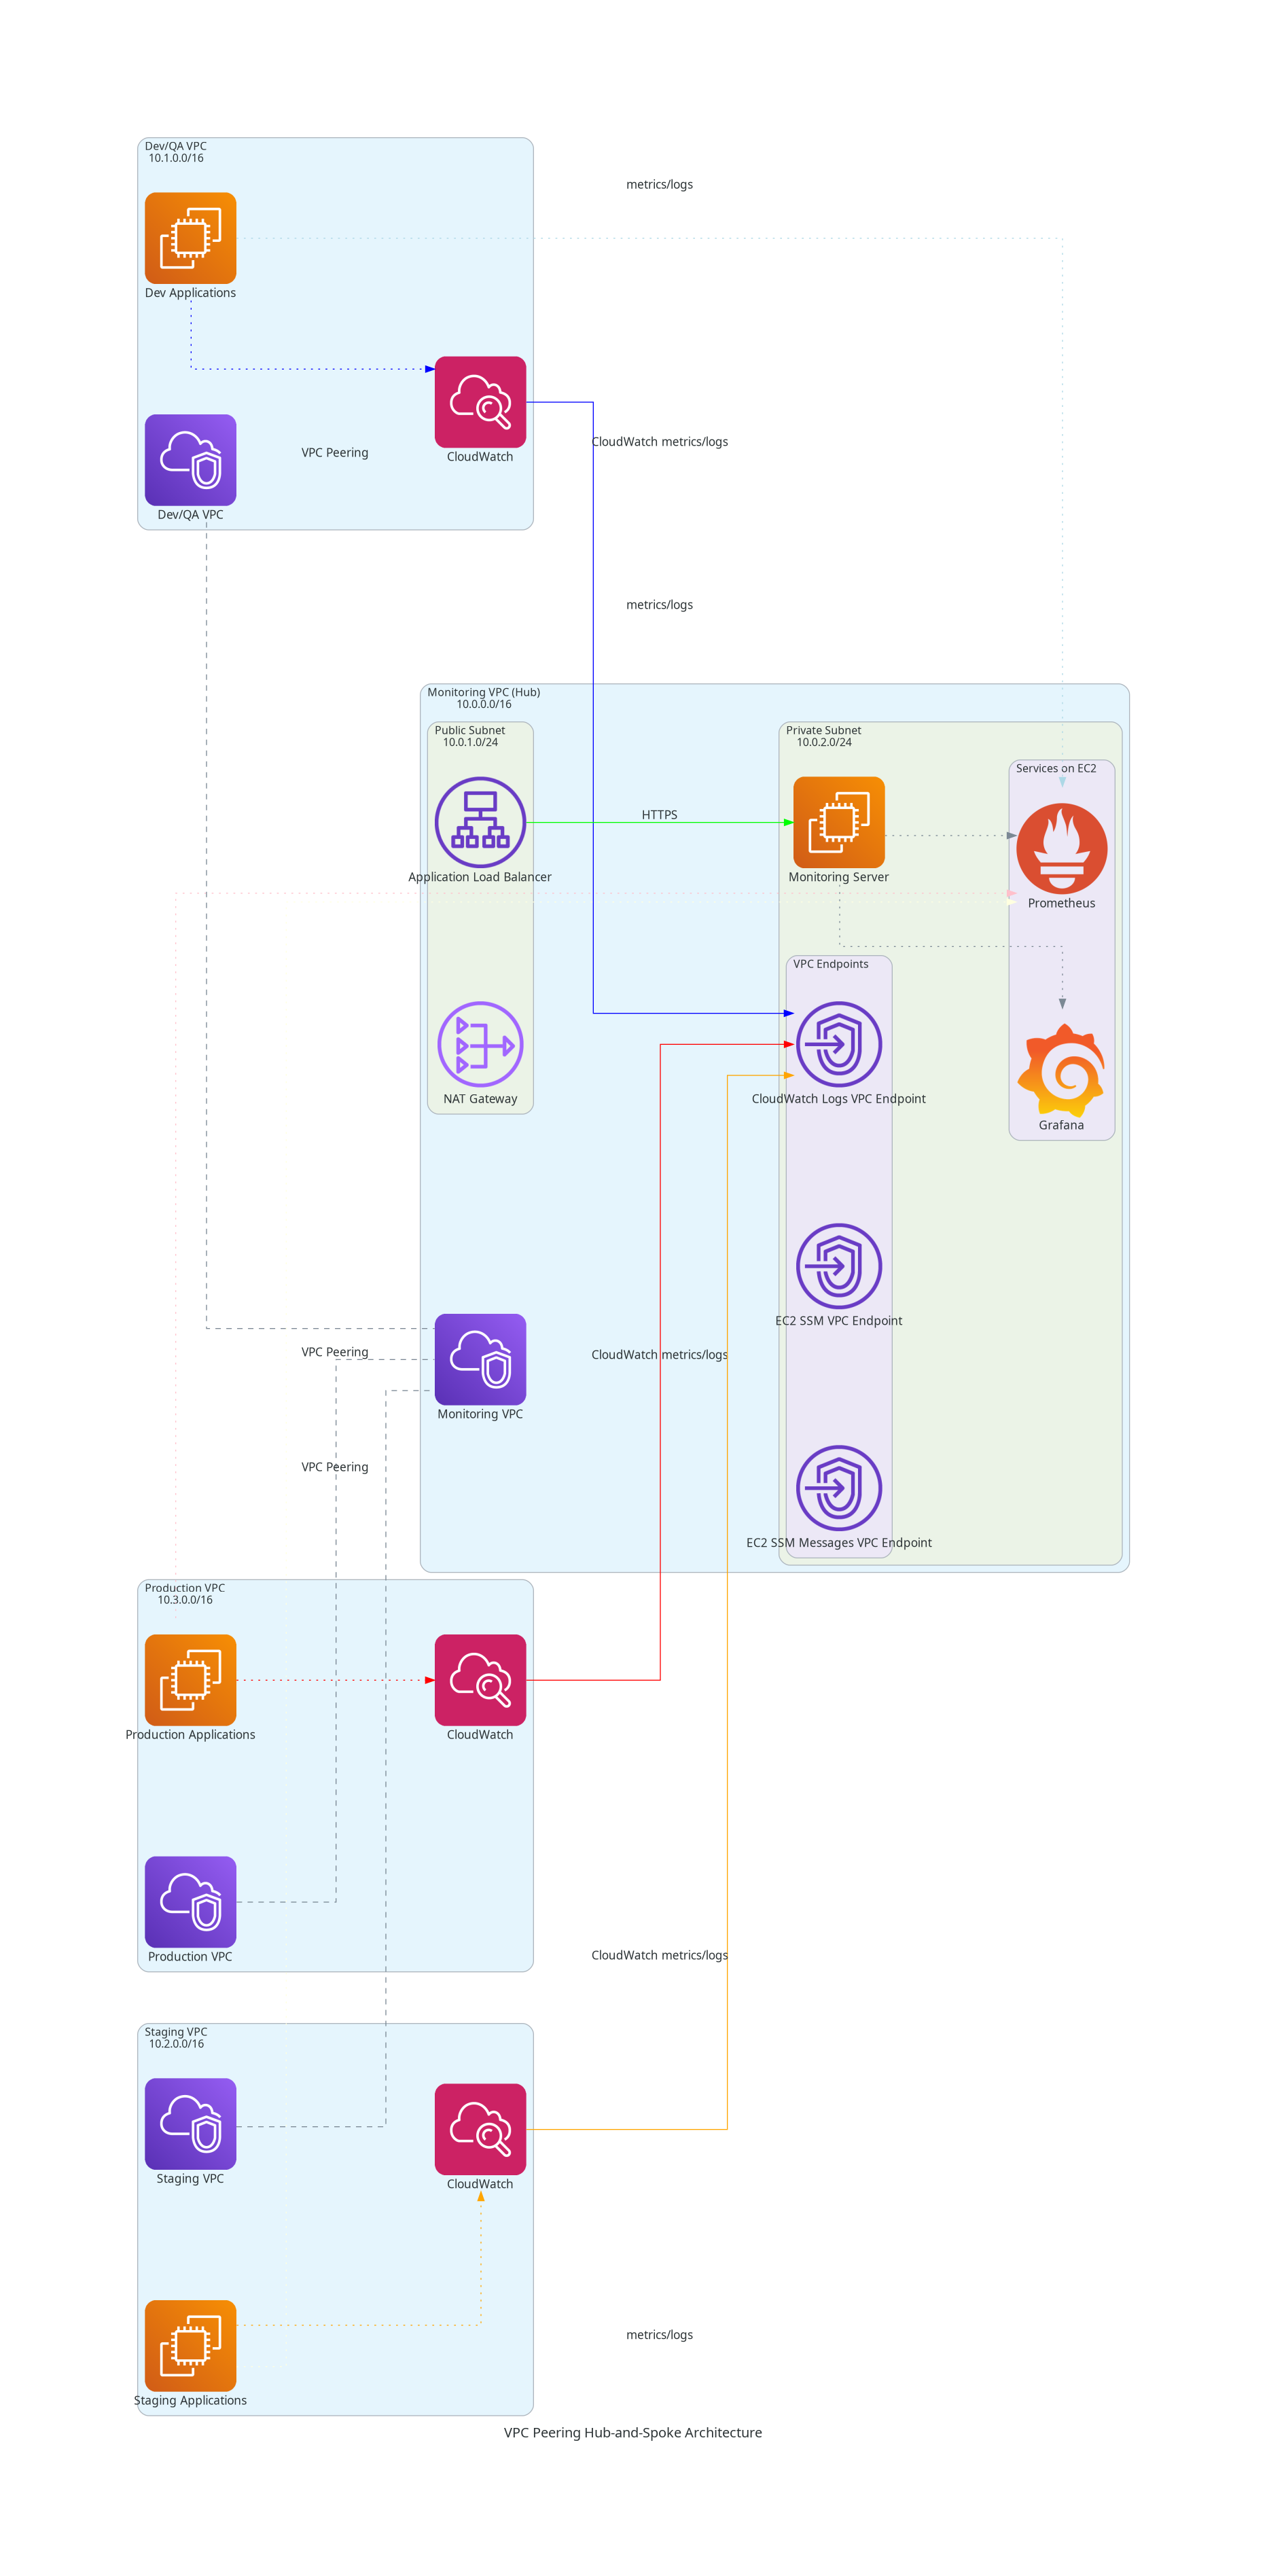
The architecture consists of four VPCs arranged in a hub-and-spoke pattern:
- Central Monitoring VPC (Hub): Acts as the monitoring hub with Prometheus and Grafana
- Dev/QA VPC: Development and QA environment
- Staging VPC: Pre-production staging environment
- Production VPC: Production environment
Key Design Principles
1. Hub-and-Spoke Network Topology
Each spoke VPC (Dev/QA, Staging, Production) has a VPC peering connection only with the central monitoring VPC. This design ensures:
- Network Isolation: Dev/QA, Staging, and Production environments cannot directly communicate with each other
- Centralized Access: All monitoring traffic flows through the central hub
- Simplified Routing: Reduces the number of peering connections from N×(N-1) to N connections
2. Dual Monitoring Strategy
The architecture implements two complementary monitoring approaches:
CloudWatch Integration via VPC Endpoints
- Each spoke VPC sends CloudWatch metrics and logs to VPC endpoints in the monitoring VPC
- VPC endpoints include:
- CloudWatch Logs VPC Endpoint
- EC2 SSM VPC Endpoint
- EC2 SSM Messages VPC Endpoint
- Provides native AWS monitoring and log aggregation
Metrics via Prometheus
- Applications in each spoke VPC send custom metrics directly to Prometheus server in the monitoring VPC
- Enables application-specific monitoring and custom alerting
- Grafana provides visualization and dashboard capabilities
3. Secure Access Pattern
The monitoring VPC implements a layered security approach:
- Public Subnet: Contains Application Load Balancer for external access and NAT Gateway for outbound connectivity
- Private Subnet: Houses the monitoring EC2 instance with Prometheus and Grafana, along with VPC endpoints
- Security Groups: Restrict access to monitoring services through the ALB only
Benefits of This Architecture
Enhanced Security
- Network Segmentation: Environments are completely isolated from each other
- Controlled Access: Monitoring access is centralized and controlled through the ALB
- Private Monitoring: Core monitoring infrastructure resides in private subnets
Operational Efficiency
- Single Pane of Glass: All environment metrics visible in one Grafana instance
- Simplified Management: One monitoring stack to maintain instead of per-environment deployments
- Cost Optimization: Shared monitoring infrastructure reduces overall costs
Scalability
- Easy Environment Addition: New environments only need peering with the monitoring VPC
- Horizontal Scaling: Monitoring infrastructure can be scaled independently
- Flexible Routing: Simple to add new monitoring tools or modify data flows
Implementation Considerations
VPC Peering Limitations
- Non-Transitive: Spoke VPCs cannot route through the hub to reach each other (which is desired in this case)
- IP Address Overlap: Ensure non-overlapping CIDR blocks across all VPCs
Monitoring Data Flow
- Applications generate metrics and logs
- CloudWatch metrics flow through VPC endpoints to the monitoring VPC
- Custom application metrics are sent directly to Prometheus via VPC peering
- Grafana aggregates and visualizes data from both sources
- External access to dashboards is provided through the ALB
High Availability
- Deploy monitoring EC2 instances across multiple Availability Zones
- Use Auto Scaling Groups for monitoring infrastructure resilience
- Implement proper backup strategies for Prometheus data and Grafana configurations
Use Cases
This architecture pattern is ideal for organizations that:
- Manage multiple AWS environments requiring isolation
- Need centralized monitoring and observability
- Want to maintain security while enabling operational visibility
- Require both AWS native monitoring and custom application metrics
- Seek to optimize monitoring infrastructure costs
Conclusion
The VPC peering hub-and-spoke pattern provides an elegant solution for centralized monitoring while maintaining environment isolation. By combining AWS CloudWatch integration with Prometheus and Grafana, this architecture delivers comprehensive observability across all environments through a single, secure monitoring platform.
The pattern scales well as organizations grow, making it easy to add new environments or modify monitoring requirements without affecting the core infrastructure or compromising security boundaries.